

The Strava mobile activity feed is nice and snappy, but did you ever notice that the experience isn't the same on your desktop?
I'm referring to your user profile page you see when you try to search through your own activities in the browser.
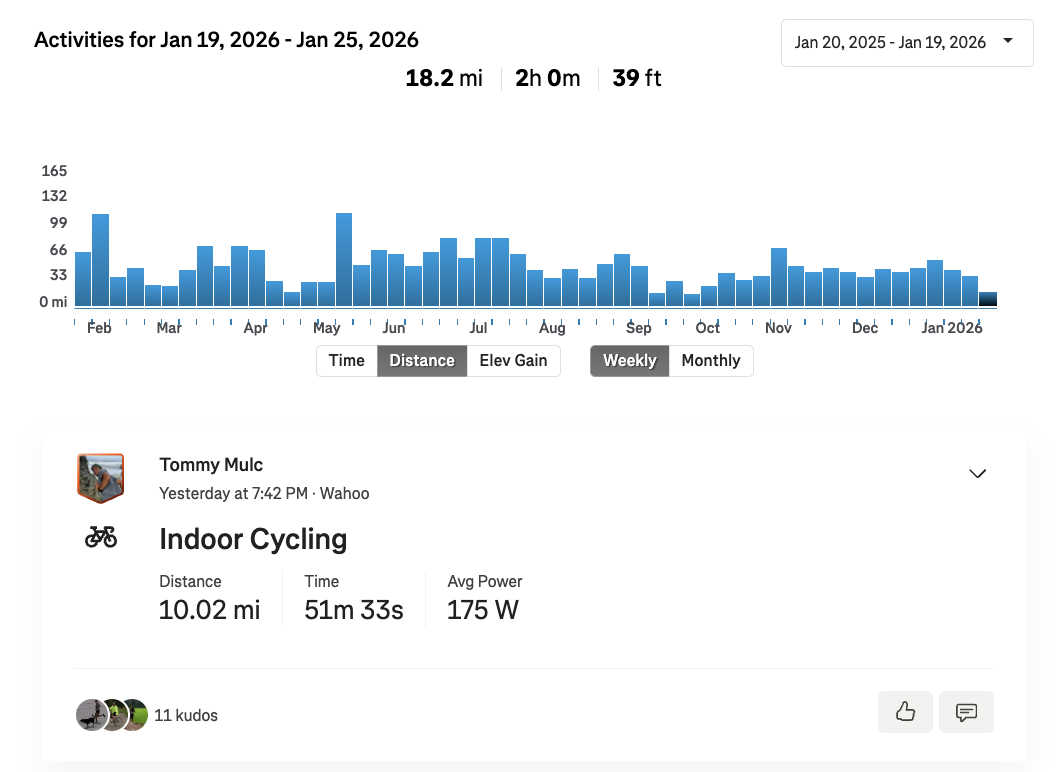
I'm usually looking up activities on my phone, but a few times a week, I find myself trying to use my laptop instead, and the experience is . . . a tad slow.
When testing the site, if you search for a random date, the wait time for the server to respond after you click a date was about 2.5 seconds (I tested this using my own data for a couple dozen dates).
This might not seem too slow, but when you consider that you only get about 7 activities at a time (assuming you are active once a day), you realize it's a pretty painful experience trying to find what you're looking for. You wait about 1/3 of a second per activity, or 333ms—a lot if you have a lot of activities.[1]
We were wondering, is there a faster way that would make navigating more enjoyable? At a first glance, there should be. The Strava mobile app doesn't have this "waiting" issue—it feels highly responsive.
Looking at Garmin
We first looked at the wait time for the Garmin website. They implemented their page as a "scroll to paginate," similar to what you get on the Strava mobile app. There's no global view of your data, and you have to just keep scrolling to find your activities. While there's a search bar to help you get to your activities sooner, unless you title your activities on Garmin Connect (I personally don't know many people who do), this isn't going to be of much help.
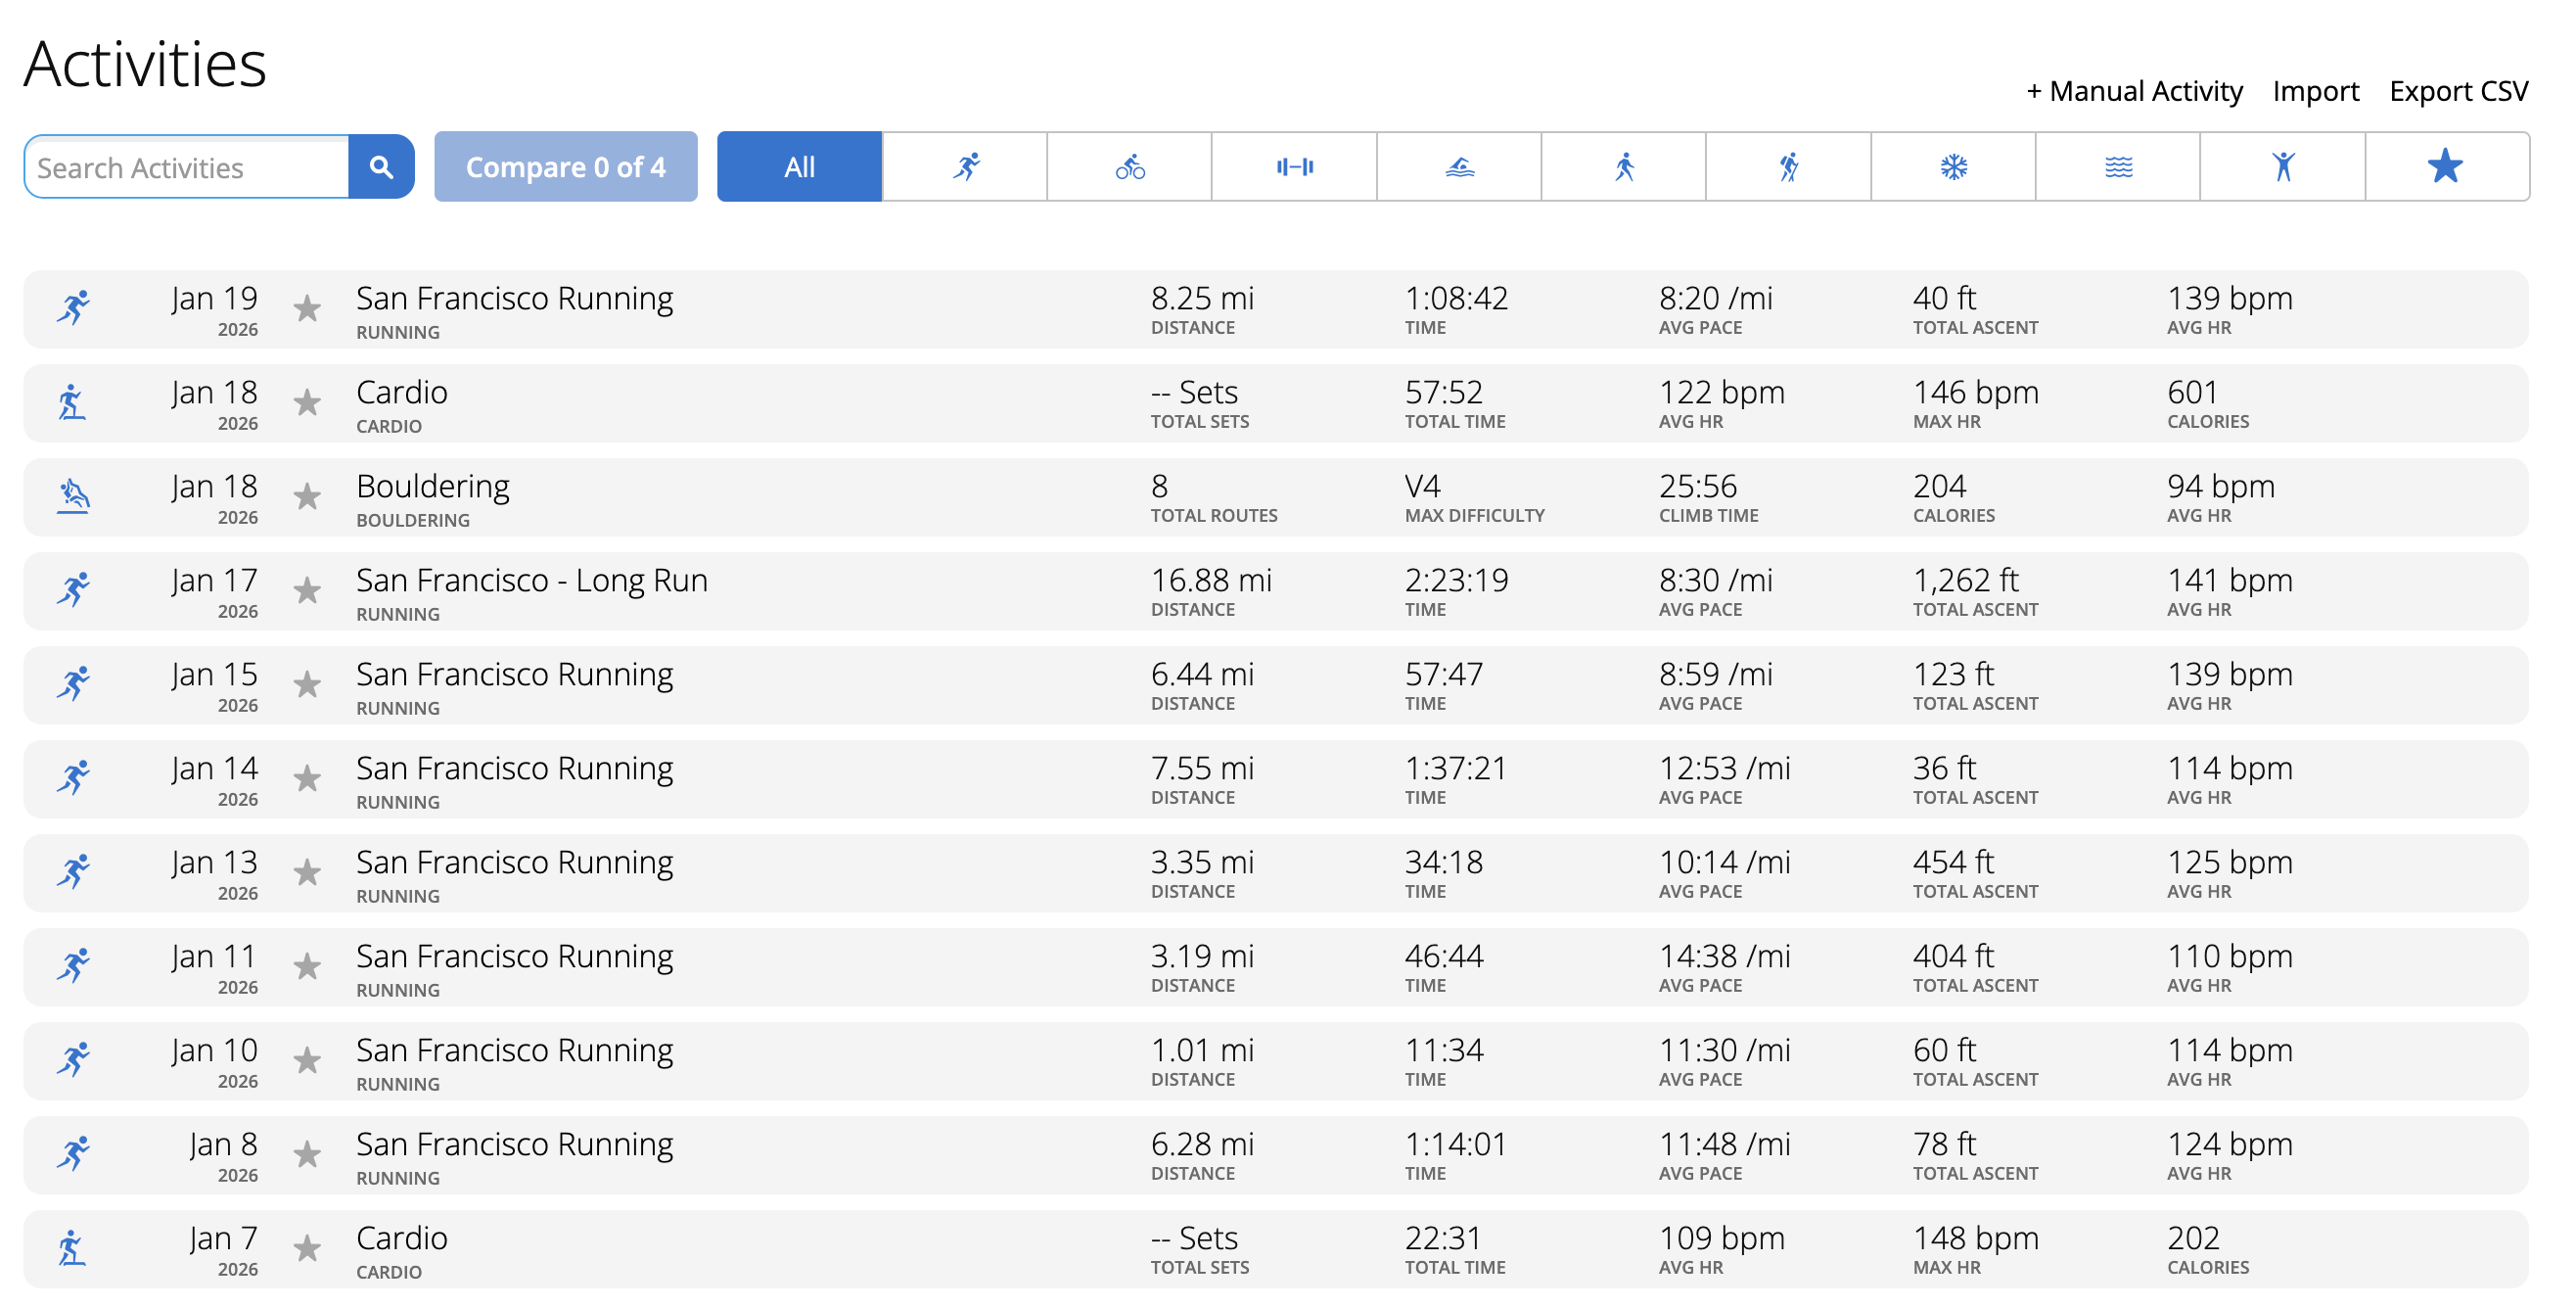
Each time you wait for the Garmin page to load more activities, you get 20 activities, and it happens fairly instantly—175ms on average. Per activity, that's 8.75ms—pretty good!
Our Approach
So it was our time to try and provide something even faster. We took a different approach than both Strava and Garmin. We wanted all your data available on a single page. No more clicking "next" or aimlessly trying to remember what date you ran that killer track workout. All the activities should be available on a single load.
Our initial take was surprisingly quick. I was able to load over 2k activities across 5 years in 7 seconds. While the 7 seconds is still way too long for a page load, it's only 3x the amount of time it takes to load a single week on the Strava site. The time per activity of our implementation was only 3.26ms, a ~100x speed up over Strava. We don't load images, which saves a lot of bandwidth, time waiting, and browser rendering, but that's not what our users are looking for anyway.
We've since optimized the experience, and the activities on the page take about 1.23 seconds or 1230ms to load. For 2150 activities, that's 0.57ms per activity, a 15x speedup over Garmin, and over 500x speedup over Strava. This is the same both on desktop and on mobile.
The Chart View
We added a chart which nicely summarizes your data at different time intervals.
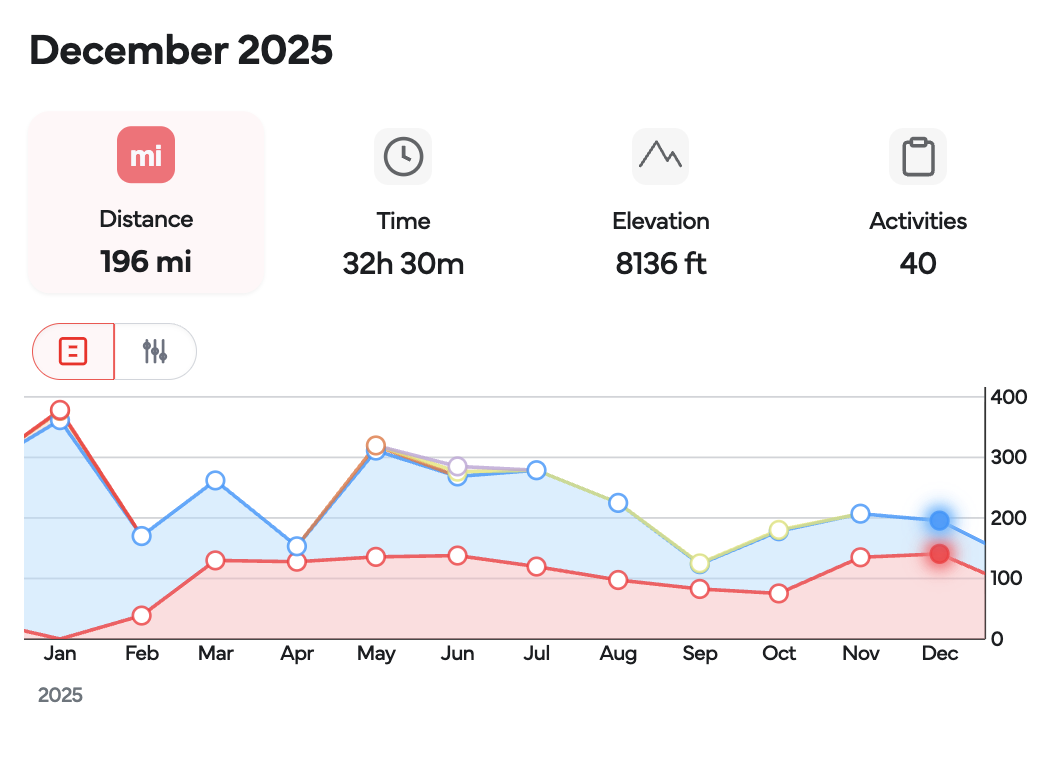
For example, you can see running mileage by day, week or month, for as long as you'd like. We also give the option to look at other statistics, like total time spent across all activities. Oh, and the chart is navigable, meaning you can click on a date in the chart, and we'll point you to all the activities around that date.
What's Next
We recently added a search bar to the page, so you can jump to your activity with a type. Potential upcoming additions will include integrating our search feature from our Chat Beta for a natural language search, and augmenting the activities with geo data for location-based search.
Performance Comparison
| Platform | Time per Activity | Relative Speed |
|---|---|---|
| Strava (desktop) | 333ms | 1x (baseline) |
| Garmin Connect | 8.75ms | 38x faster |
| Kailo | 0.57ms | 584x faster |
[1] The profile page also provides images, but these measured wait times are just for the activity data, and don't include the additional wait time for images (you can expect to wait about 2-3x as long for the page to fully render).